US Stocks Slump, Indicators Give Warning Signs
The market indicators that give investors signals about current situations are now signaling the worst. This has fueled concerns that other indexes could revisit the position they were in the middle of June when a bearish market held sway.
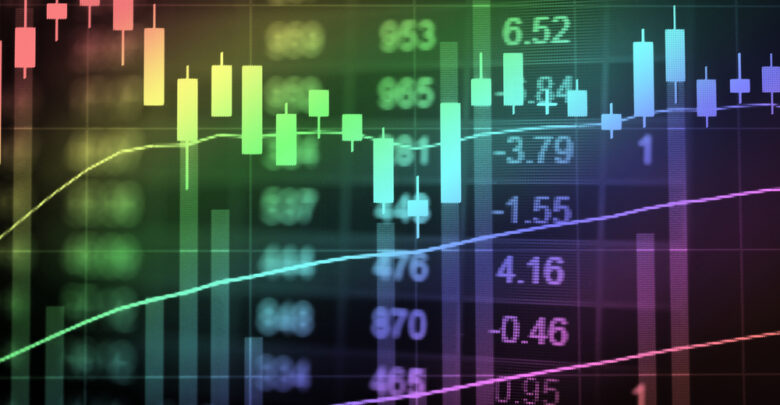
Falling Gradually Since August
The S&P 500 has gone down by 7% since the middle of August after the sudden rally during summer. The index was affected by the expectations that the US Federal Reserve is going to raise interest rates to a higher level than what was anticipated previously as it fights to reduce the high cost of commodities from their four-decade height.
The ongoing stock market pullback is presenting more reasons for cautiousness to market speculators as they watch the market’s momentum, breadth, as well as its trading trajectory. They would need to get an accurate perspective before they make decisions on their investments.
Note that most of these indicators painted hopeful pictures a few weeks back. They now inspire a not-so-bullish story and make investors concerned that the selloff trend the market has experienced this year might not be over.
Macro Risk Advisors’ Chief Strategist, John Kolovos, said he was forced to technically downgrade expectations due to the kind of decline and severity that has been experienced in three weeks. He said further that there were bets in June that there would have been a boom at this time, but it has now changed to seeing just a better market.
The Market Watched Closely
The market’s breadth is one of the factors that investors look out for as it shows if a good number of shares are either rising or falling. A positive breadth is when there are more shares advancing than those declining. It indicates that there is high confidence among bulls.
But the market’s breadth has been sending worrisome signals recently. The shares that trade above their individual 50 daily moving averages on the Russell 3000 index dropped to 30% from where it was at 86% in the middle of August.
Kolovos stated again that analysts are waiting to see the Russell 3000 stabilizing at its current position. They don’t want it going anywhere under 25%.
Whereas the 15 daily moving average of the S&P 500 shares reached a new low. Thrasher Analytics founder, Andrew Thrasher, said they are on the lookout if the bearish breadth will continue. He explained further that if there is a new low, it would add more pressure to the index.
Note that the S&P 500 has stayed under its 200 daily moving average for up to five months. That marks the longest period it has been under since 2009.


More Stories
FTX EU Unveils Withdrawal Platform for Swift Repayment to European Users
FTX EU received regulatory approval from the Cyprus Securities and Exchange Commission (CySEC) in March 2022. This approval came just...
CCP Games Generates $40 Million in Funding Round to Develop a Triple-A Blockchain Game
The Iceland-based blockchain gaming platform CCP games have raised $40 million in a funding round led by Andreessen Horowitz. The...
Switzerland Legislators Formulating Emergency Measures For UBS Acquisition of Credit Suisse
A report from the Switzerland financial watchdogs in collaboration with the Swiss National Bank (SNB) revealed that the impending acquisition...
Polygon Labs Partnering with Salesforce to Develop NFT Loyalty Program
The San Francisco-based software development company Salesforce has partnered with Polygon Labs to create an innovative NFT loyalty program. The...
Ripple Partnering with Blockchain Founder Fund to Increase Web3 Adoption
The US-based crypto service provider Ripple has announced plans to support Blockchain Founders Fund (BFF) in transforming blockchain technology globally....
Former FTX Executive Predicts Fierce Competition between Banks and Crypto Firms Following the Silvergate Fallout
On March 14, Brett Harrison, a former FTX top executive, issued a report arguing that the fallout of the fast-growing...