USD/MXN & XAU/USD Update: Analysts Predict Further Pressure on USD/MXN as Spot Gold Continues Uptick
USD/MXN Pair
The USD/MXN currency pair has snapped a three-day losing streak, rising in value in recent trading sessions. While this is certainly a positive development for the pair, there are still concerns about the pressure on it. Analysts predict the pair will continue under pressure, as it has fallen significantly from its 2022 highs of $21.05.
Despite the recent gains, the USD/MXN pair still has a ways to go before it fully recovers. As of the time of writing, the pair is trading at 18.4076, up 0.25% from Monday morning’s price. It remains to be seen whether the pair will be able to sustain this upward momentum or if it will face further pressure in the coming days and weeks.
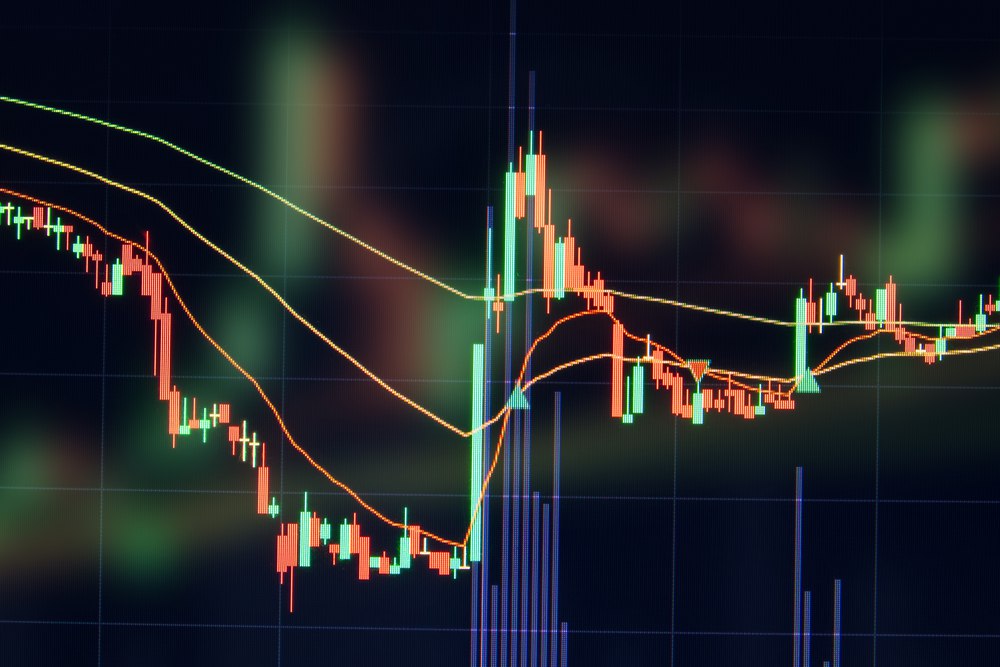
When analyzing the technical indicators of the USD/MXN currency pair, it’s clear that the daily chart shows a bearish continuation as the most likely outcome moving forward. This movement indicates that traders and investors should be prepared for the pair to experience further downward pressure in the coming days and weeks.
However, it’s worth noting that there is an interesting divergence between the RSI and the USD/MXN price action. Despite the bearish outlook, the RSI has remained unmoved, potentially opening the door for the pair’s buyers to reclaim the psychological level of 19.00.
However, as the price action registers new lows, the RSI is not following suit, indicating that the reversal risks remain. This trend could lead to further opportunities for an uptick in the pair as buyers take advantage of the situation.
For this scenario we’ve discussed play out, there are certain key levels that the USD/MXN pair needs to break through. Firstly, it must overcome the confluence of the downward resistance trendline and the 20-day EMA at 18.6951. Then, it should be followed by a move towards February’s 15th daily high of 18.7479, exposing the 50-day EMA trading at 18.9669 ahead of the psychological level of 19.00000.
On the other hand, if the pair fails to break through the 18.4000 mark, this would suggest a bearish future, and traders should prepare for further downward pressure. In this scenario, the next level of support would be the YTD low, which currently stands at 18.33301. Then, if the pair continues declining, it could reach the psychological price level of 18.0000.
XAU/USD
In other forex news, spot gold has continued its recent uptick, with XAU/USD trading at $1847 in mid-morning euro time. According to the latest data, support levels for XAU/USD are at 1,824.60, 1,811.30, and 1,797.45. If the price of gold drops to these levels, traders can expect an increase in buying activity as investors look to capitalize on lower prices.
On the other hand, resistance levels for XAU/USD are at 1,838.90, 1,854.00, and 1,870.50. These levels indicate areas where traders can expect selling activity to be strong enough to prevent the price of gold from increasing further.
The financial markets are still digesting the recent hawkish signals from the Federal Reserve, which has left many investors concerned about the potential for further rate hikes. The Federal Reserve’s policymakers have made it clear they anticipate more rate hikes due to inflation tripling the Fed’s target of 2%. Unfortunately, hopes for a slowdown in rate hikes are not on the horizon.


More Stories
FTX EU Unveils Withdrawal Platform for Swift Repayment to European Users
FTX EU received regulatory approval from the Cyprus Securities and Exchange Commission (CySEC) in March 2022. This approval came just...
CCP Games Generates $40 Million in Funding Round to Develop a Triple-A Blockchain Game
The Iceland-based blockchain gaming platform CCP games have raised $40 million in a funding round led by Andreessen Horowitz. The...
Switzerland Legislators Formulating Emergency Measures For UBS Acquisition of Credit Suisse
A report from the Switzerland financial watchdogs in collaboration with the Swiss National Bank (SNB) revealed that the impending acquisition...
Polygon Labs Partnering with Salesforce to Develop NFT Loyalty Program
The San Francisco-based software development company Salesforce has partnered with Polygon Labs to create an innovative NFT loyalty program. The...
Ripple Partnering with Blockchain Founder Fund to Increase Web3 Adoption
The US-based crypto service provider Ripple has announced plans to support Blockchain Founders Fund (BFF) in transforming blockchain technology globally....
Former FTX Executive Predicts Fierce Competition between Banks and Crypto Firms Following the Silvergate Fallout
On March 14, Brett Harrison, a former FTX top executive, issued a report arguing that the fallout of the fast-growing...